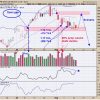
The Tuesday afternoon selloff brings the broader indexes close to key support levels. In the first half of the trading day, the S&P 500 ($SPX) and Dow Jones Industrial Average ($INDU) were trading slightly higher. The Nasdaq Composite ($COMPQ) was the leader in the morning hours. But towards the last couple hours of the trading day, all three indexes sold off.
The bigger question is how much damage two down days in a row caused. With the broader stock market indexes rising to new highs, seeing two down days in a row is a bit disappointing. But a selloff is healthy, especially as we approach the end of the year, as long as the bullish trend is still intact.
The chart of the S&P 500 and Nasdaq Composite below shows that both indexes have an upward trending 21-day exponential moving average (EMA). However, the S&P 500 is getting close to its November high, which is a valid support level. The Nasdaq has a ways to go before it reaches its November high. A closer support level is a low of the December 4 price move, a gap up.
FIGURE 1. S&P 500 AND NASDAQ COMPOSITE SELL OFF. Although the bullish trend is still in play, watch the support levels and moving average convergence/divergence (MACD) for signs of a downtrend.Chart source: StockChartsACP. For educational purposes.
The moving average convergence/divergence (MACD) in the lower panel shows that the S&P 500 is the weaker of the two indexes, technically speaking. Since October, the MACD has been relatively flat while the S&P 500 was rising. The MACD for the Nasdaq was in a slight incline while the index was rising.
The good news is that the seasonally strong part of the month is yet to come. December and January tend to do well with the Santa Claus rally, the January Effect, and the January Barometer, three seasonal patterns discussed in the Stock Trader’s Almanac. The Cboe Volatility Index ($VIX) remains low, which is another variable that supports the bullish move in equities. We should get more clarity on Wednesday after the November CPI data is released.
Precious Metals Rise
While equities were selling off, gold and silver prices started inching higher. The surge in gold prices can be attributed to China’s central bank deciding to buy gold, something it hasn’t done in several years.
Gold prices pulled back to the 100-day SMA after reaching an all-time high at the end of October. Since then, it has been trending higher and could make another attempt to reach its high (see chart of gold continuous contract below).
FIGURE 2. GOLD FUTURES TRYING TO BREAK OUT OF A RESISTANCE LEVEL. If gold prices break above the resistance level, price could make an attempt to reach its all-time high.Chart source: StockCharts.com. For educational purposes.
Tuesday’s low coincided with the 50-day SMA, and the high coincided with previous highs. You could say that $GOLD traded between a support and resistance level. A successful break above Tuesday’s high would confirm that gold prices could aim to reach an all-time high.
A few geopolitical events surfaced this week that may have contributed to the rise in crude oil prices, which saw Treasury yields rise slightly. But these could be short-lived news-driven reactions.
NVIDIA’s Slide
One stock I’ll be closely watching is NVIDIA Corp. (NVDA). The Chinese government is investigating the company for antitrust activities. NVDA closed below its 50-day SMA on Tuesday with a declining StockCharts Technical Rank (SCTR) score of 50.20. The MACD is also indicating slowing momentum (see chart below).
FIGURE 3. NVIDIA’S STOCK PRICE FALLS BELOW 50-DAY MOVING AVERAGE. In addition, the SCTR score is at 50, which indicates weak technical strength. The MACD shows momentum is declining.Chart source: StockCharts.com. For educational purposes.
A further decline in NVDA’s stock price, which makes up about 7% of the S&P 500, could lower the index’s value.
The bottom line: November CPI will be released on Wednesday morning, 8:30 AM ET. Economists estimate a 2.7% year-over-year increase while the core CPI is expected to rise 3.3%. This would dictate Wednesday’s price action.
Disclaimer: This blog is for educational purposes only and should not be construed as financial advice. The ideas and strategies should never be used without first assessing your own personal and financial situation, or without consulting a financial professional.


