Editor’s note: This week’s issue of Joe Duarte’s Smart Money Trading Strategy Weekly is being produced early due to the Christmas Holidays. Good holiday wishes to everyone.
Worried and Watchful. Sticking with Momentum for Now
There are those two old sayings in the markets, accredited to the late great Wall Street Marty Zweig: “Don’t fight the Fed, and don’t fight the market’s momentum.” Right now, they are as applicable as ever. On the other hand, as Mr. Zweig was also fond of saying: “I’m the most worried, when I’m not worried.”
That’s where I am right now. Hanging on to my longs, but also worried about staying at the party too long. If I stop worrying, I’ll probably go to 100% cash. On the other hand, if the market rolls over in a big way, I’ll be worried that I didn’t sell fast enough.
Bullish Sentiment is Way Out There
I don’t want to spoil the holiday mood. But when I see the CNN Greed and Fear Index rise above 75, I pay attention. And its recent reading of 80 (12/20/2023) caught my attention. This is one of several sentiment gauges that I follow, but it is reliable in the sense of pointing out sentiment extremes, even if it’s not always useful in its timing. But other sentiment measures such as the CBOE Volatility Index (VIX, see below) and the CBOE Put/Call Ratio (CPC) are not screaming as loudly, so it looks as if the rally still has some legs.
Of course, much of the market’s current rally has to do with seasonality, expectations about rate cuts in 2024, and the fact that lots of fund managers were under-invested while others were actually short stocks way back in October when the potential for a rally became evident, as I noted here.
Stick With the Plan
Periods in the market where prices go off the rails to the upside are usually the final stages before a meaningful decline, and are known as blowoffs. But they can last longer than anyone expects. As a result, the best approach is to recognize the situation and plan accordingly.
One important part of any plan, as I described in my latest Your Daily Five video, is to focus on value – those areas of the market that have lagged the rally. That’s because those are areas where there may still be some bargains.
Meanwhile, any worthwhile trading plan should include the following basic tenets:
Stick with what’s working; if a position is holding up – keep it;Take profits in overextended sectors;Consider some short term hedges;Look for value in out of favor areas of the market that are showing signs of life; andProtect your gains with sell stops and keep raising them as prices of your holdings rise.
Where Bonds Go, Stocks Follow; And Where There is Value, Berkshire will Sniff it Out
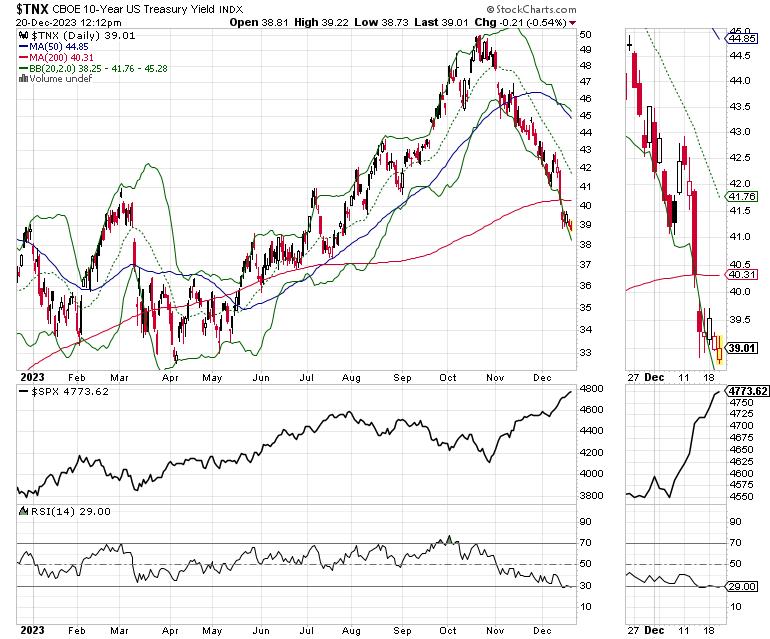
As I noted way back in October, the rise in bond yields, which took the U.S. Ten Year Note (TNX) to 5%, was way overdone and, when the reversal took hold, it would likely be spectacular. Moreover, given the bearishness of the period, I also expected a subsequent rally in stocks. So far, that’s what we’ve seen.
The U.S. Ten Year Note yield (TNX) remains below the key 4% level, which I’ve noted was a significant level. Interestingly, one of the most bullish responses to the breach of 4% has been the value sector. You can see this expressed in the shares of the Vanguard Value ETF (VTV).
Interestingly, VTV’s largest holding is Berkshire Hathaway (BRK/B), which of course is Warren Buffett’s quasi-ETF. What many often fail to note regarding Berkshire is that its holdings are as value-oriented as imaginable.
For example, Berkshire disclosed that it went into the homebuilder stocks in a big way a few weeks ago, and the sector has exploded. So, is there value in homebuilders? Sho nuff, if you look at D.R. Horton’s P/E ratio you find that its just above 10.6. Compared to the S&P 500 (SPX), whose P/E is just above 26, the answer is clear. I own shares in DHI.
Still, you can have value metrics combined with momentum charts, as you see in the price charts for the SPDR S&P Homebuilders ETF (XHB) and in Berkshire. Moreover, it’s wise to keep track of what’s happening with the price of these and other well-appreciated assets and consider your options when it comes to managing the number of shares you own in any position.
Certainly, the homebuilders have come a long way since I recommended them back in late September, so they are well due for a consolidation, which can come at any time. But, for now, momentum continues to build.
A key influence, as I noted last week, is the sustained break in mortgage rates below the 7% point. As long as mortgages remain below this important rate, the odds of more than a moderate pullback in homebuilder stocks is likely to remain low, until proven otherwise. Meanwhile, a test of the 6.8% level for the average mortgage is looming.
For the big picture on homebuilder and real estate stocks, click here. For detailed Buy and Sell recommendations on homebuilders, click here.
A Quick Word About Shipping Stocks
Over the last few weeks, I’ve noted that the global shipping sector had the potential for appreciation. I initially cited the drought in Panama and its adverse effects on the Panama Canal as an important contributor to this potential. Unfortunately, the situation in the Red Sea, related to the situation in the Middle East, is an increasing contributor.
You can see the huge move in the SonicShares Global Shipping ETF (BOAT), which gapped well above the bullish trading range I noted was in place in this space last week. Unfortunately, a rise in shipping costs and a subsequent snarling of the global supply chain will likely trigger inflation.
I recently recommended a shipping stock which has just broken out. You can check it out with a FREE two week trial to my service here.
Market Breadth Gains Momentum
The NYSE Advance Decline line (NYAD) remains overbought, but is entering a trading pattern suggestive of a major momentum thrust, as it tests its recent highs. NYAD continues to trade above its 50- and 200-day moving averages, which could extend until the end of the year and perhaps into January. A move back to the 20-day moving average is not out of the question. The key is whether it holds. If it does, then the odds of a resumption in the uptrend will increase.
The Nasdaq 100 Index (NDX) is above 16,000 as the Fed’s bullish talk squeezed short-sellers. NDX is now trading outside its upper Bollinger Band, suggesting that a short-term correction or consolidation is near. Both ADI and OBV are rising, so the overbought condition could increase before any consolidation.
The S&P 500 (SPX) rallied above 4600 thanks to the Fed. RSI is well above 70. A consolidation, and perhaps a move back to the 20-day moving average, should be expected at some point, but momentum continues to build.
VIX Remains Below 20
The CBOE Volatility Index (VIX) is 20, a bullish posture for stocks. If VIX remains subdued, more upside is possible.
A rising VIX means traders are buying large volumes of put options. Rising put option volume from leads market makers to sell stock index futures, hedging their risk. A fall in VIX is bullish, as it means less put option buying, and it eventually leads to call buying. This causes market makers to hedge by buying stock index futures, raising the odds of higher stock prices.
To get the latest information on options trading, check out Options Trading for Dummies, now in its 4th Edition—Get Your Copy Now! Now also available in Audible audiobook format!
#1 New Release on Options Trading!
Good news! I’ve made my NYAD-Complexity – Chaos chart (featured on my YD5 videos) and a few other favorites public. You can find them here.
Joe Duarte
In The Money Options
Joe Duarte is a former money manager, an active trader, and a widely recognized independent stock market analyst since 1987. He is author of eight investment books, including the best-selling Trading Options for Dummies, rated a TOP Options Book for 2018 by Benzinga.com and now in its third edition, plus The Everything Investing in Your 20s and 30s Book and six other trading books.
The Everything Investing in Your 20s and 30s Book is available at Amazon and Barnes and Noble. It has also been recommended as a Washington Post Color of Money Book of the Month.
To receive Joe’s exclusive stock, option and ETF recommendations, in your mailbox every week visit https://joeduarteinthemoneyoptions.com/secure/order_email.asp.


