The S&P 500 posted its worst month so far, with a 4.9% decline that’s pushed the year-to-date returns for this benchmark index almost in half. With elevated interest rates that may be with us for a while, investors have pushed stocks lower, in a move that has over 10% of large-cap stocks well into oversold territory. We’re talking about names such as McDonalds (MCD), Boeing (BA) and Blackrock (BLK), to name just a few.
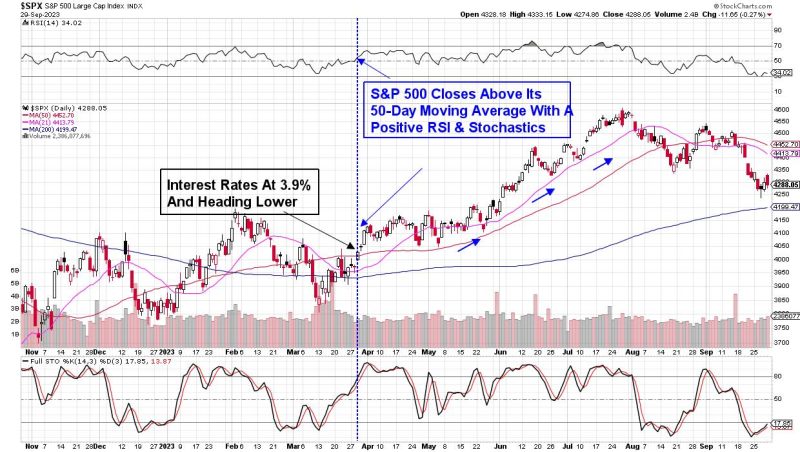
The current downtrend in the markets was signaled by a close below the 50-day moving average on heavy volume earlier this month, which was coupled by a move of the RSI and Stochastics into negative territory. Further weakness followed, with news that the Fed is anticipating an elevated rate scenario for longer than anticipated, pushing stocks even lower.
DAILY CHART OF THE S&P 500 INDEX
Above is a daily chart of the S&P 500, and highlighted are the key characteristics that need to take place before we’re back in an uptrend. To begin, we’ll need this index to close above its 50-day moving average, coupled with a positive RSI and Stochastics. While this may appear far from possibly taking place, a multi-day rally in the mega-cap names such as Microsoft (MSFT) and Alphabet (GOOGL), which led us out of the March pullback, would go a very long way in sparking a reversal.
Outside of price action on the chart of the S&P 500, we’ll need to see interest rates trend lower from their current position. During the mid-March downtrend reversal, the yield on the 10-year Treasury note closed below the widely-watched 4% level after a lower-than-expected CPI report hinted at decelerating inflation. A similar drop in interest rates will be a key needed development to get investors back into these markets.
While we’re on the lookout for the markets to trend higher going into year-end, near term, we may see further weakness heading into next week. While the major indexes rebounded from midweek lows, a continuation rally into Friday was reversed, in a signal that the short-lived rally attempt had ended. The reversal followed news that a federal government shutdown is increasingly likely on Sunday after House Speaker McCarthy’s funding proposal was rejected.
With investor sentiment remaining negative over the near term, this is an ideal time to build out your watchlist for when we return to a more bullish period. For those who’d like to have immediate access to my highly curated watchlist, as well as be alerted to when it’s safe to get back into the markets, use this link here.
Warmly,
Mary Ellen McGonagle


