


While gold is seen as a stable asset, it’s not immune to gains and losses. For this reason, understanding the trends that move the gold price is important for investors who have this popular precious metal in their portfolio.
What is gold technical analysis?
In order to understand why gold technical analysis is important, let’s first break down what it is.
Put simply, technical analysis forecasts price direction through the study of past market data, and is primarily done by exploring price and volume. Technical analysis can be applied to diverse sectors, including gold.
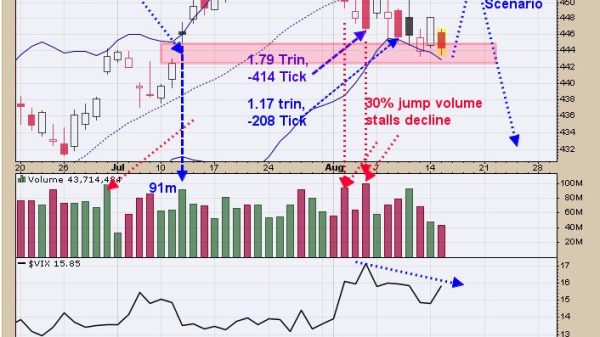
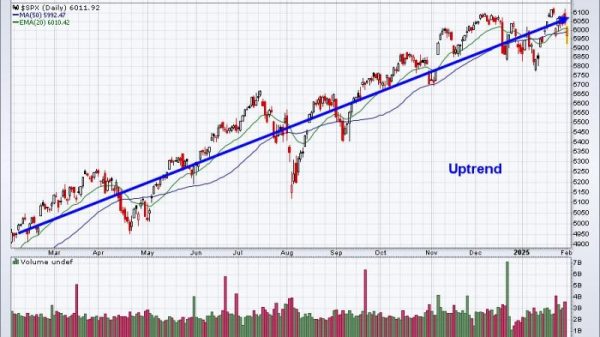
Chart showing upward trend in the gold price.
The chart above shows an upward trend line. The higher lows in this line represent support levels for the gold price, which all fall along the trend line. Uptrend analysis deals with past price increases and how they may give evidence for future gains; in contrast, downtrend analysis looks at past declines and how they could indicate future slumps.
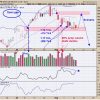
Chart showing downward trend in the gold price.
Chart via Trade Gold Trading.
The trend line shown in the chart above is moving downward, with the lowest lows indicating support levels for the gold price; meanwhile, the tops represent resistance levels for the yellow metal.
As for sideways trend analysis, this can be used by market watchers when the gold price hovers around a particular level for a certain amount of time. It can suggest whether a rally or decline should be expected in the future.
Chart showing sideways trend in the gold price.
It’s important to keep in mind that due to different market perspectives — long term and short term — the yellow metal can be viewed as experiencing more than one trend at once.
“From a long-term perspective you might observe an upward trend, while if you zero in on a particular part of this trend (therefore switching to a short-term perspective) it is possible that you will notice a downward trend,” Sunshine Profits notes.
3 important components of gold technical analysis
Gold technical analysts attempt to identify price patterns and trends within the market; they then try to use that data to make future price predictions that can ultimately bolster their portfolios.
Although price is undoubtedly the most crucial aspect of technical analysis, momentum and sentiment are also important in understanding gold’s movements. Here’s a look at these three aspects.
1. Price
Most technical analysts will agree that price is the most important factor in what they do and how they track gold trends.
Price action describes how the gold price moves, and is key for technical analysis. As Investopedia concisely states, “Price action forms the basis for all technical analysis of a stock, commodity or other asset chart … Many short-term traders rely exclusively on price action and the formations and trends extrapolated from it to make trading decisions.”
Price action is interpreted through the use of charts that plot prices over time. Analysts use the patterns in the charts to help determine trends, looking for potential breakout and reversal points. There are literally dozens of chart patterns that traders rely on to predict future gold price action, but most can be categorized as continuation patterns or reversal patterns.
Examples of continuation patterns include wedges, pennants and triangles. Head and shoulders, double tops and double bottoms and triple tops and triple bottoms are examples of reversal patterns. How these patterns have played out in the past can give market analysts clues about gold’s price path in the future.
Watch the interview above for Soloway’s gold technical analysis.
‘What I like about gold is that we’ve seen such a strong dollar move to the upside, yet gold is still performing relatively well — that’s telling me that there’s liquidity moving into gold as a protective asset,’ Soloway commented during the conversation. ‘So I’m expecting us to start a bigger move up that eventually takes out this triple top up here around this US$2,075 (per ounce) level, and I think that’s a great interesting area to play, potentially, gold miners.’
Wolfe Research’s Roque believes that, when tracking the gold price, it’s important to research what it’s done in the past. “I think (looking at historical gold prices) is wholly appropriate for investors to consider. We can look at gold’s price today and we don’t have any idea of gold’s price historically. So I think it is important to consider the current price relative to its history,” he said.
While he admitted that understanding gold’s price history will not allow one to 100 percent determine where it is going, it does act as an informative base for which direction investors should expect it to move.
“What has gold done in prior advances? It’s very easy to determine that,” Roque said. “And then we come to some average or median advance, and we say, ‘Could gold do that?’ Maybe it can, maybe it can’t. But at least we have a basis for some future observation for gold.”
2. Momentum
In the field of gold technical analysis, momentum refers to the speed or velocity of price changes.
Tracking momentum is beneficial for analysts when they are trying to determine the strength or weakness of the gold spot price. It is worth noting that momentum is generally more useful during rising markets than during falling markets. This is because markets rise more often than they fall.
Essentially, momentum, or the momentum indicator, compares where the current price of gold sits in relation to where the price was in the past. Momentum is calculated by taking the current price of the yellow metal and subtracting a historical price — often the price from 10 days prior.
If the current price is higher than the price in the past, then the momentum indicator is positive. However, when the current price is lower than the price in the past, then the momentum indicator is negative.
This is often charted over a period of time, creating a momentum chart that shows the current trend. This indicator can alert market participants to whether they should buy or sell the precious metal.
3. Sentiment
This aspect of technical analysis puts the spotlight on investors — it looks at how they feel about a particular commodity and how that helps shape and shift its value.
Sentiment refers to the feeling or tone of a market; this is evident through the activity and price movement of gold as it is traded within that market. Technical analysts often consider market sentiment due to the fact that it influences technical indicators. As Investopedia points out, analysts use those technical indicators to “measure and profit from short-term price movements often caused by investor attitudes toward a security.”
As an example, market sentiment can be either high or low when the US Federal Reserve raises or drops interest rates. Since the yellow metal is also affected by the movements of the US dollar, things such as geopolitical tensions or a thriving economy are some of the factors that can influence sentiment.
Alongside his technical analysis of gold’s price action for the second half of 2023, Soloway doesn’t neglect the sentiment indicators in forecasting future gold prices.
“If you go to the beginning of 2023, I think we’re slightly positive on the year on gold. It’s not been the amount of upside that we’ve seen in Bitcoin or the stock market, but I will say this in terms of risk vs reward — I still think it’s a top play here for an investor,” he explained. “I expect (the gold price) to start to move up and eventually take out the highs. I think again if you look at the fear of what could happen globally — de-dollarization, the fears of everything else in the economy — gold becomes a pure play for safety, which can propel it much much higher.”
It should also be noted that not all investors follow sentiment. In fact, contrarian investors prefer to trade against current sentiment, selling when others are buying and vice versa.
What is the value of gold technical analysis for investors?
Since technical analysis is a way to glean a better understanding of where gold could be headed, it can be an important component for investors who currently own gold or who want to add it to their portfolio.
Roque said that understanding where the gold price could go is helpful to investors when they can compare where prices have been to where they currently are to get a sense of gold’s “base,” as well as the moment it completes its time resting on that base.
As an example, Roque used gold’s August 2019 rally, when the safe haven metal moved above the US$1,400 per ounce and US$1,500 levels.
Chart showing gold’s August 2019 price rally.
Chart via Trading Economics.
“When gold got above US$1,400, gold had completed, in our parlance, a Brobdingnagian base. That’s a word that we use — nobody else uses it. Of course, Brobdingnagian comes from ‘Gulliver’s Travels,’ right? Gulliver visited the island of Brobdingnag, which is where everybody was huge or everything was huge, and of course he visited the island of the Lilliputians where it was the opposite,” he noted. “We like to use the word Brobdingnagian, the adjective, to describe the base. So gold went sideways, albeit in an aggravating fashion, for six and a quarter years. By getting above US$1,400, it completed this big base.”
The managing director added that when gold completed its Brobdingnagian base, its fundamental story was manifested in the move above US$1,400.
All of that is to say that technical analysis aids investors who carefully watch the price of gold for indicators of bullish or bearish markets. It can help market participants understand if they should buy, hold or sell the yellow metal, or what the perfect time may be to get in or out of the gold market.
Securities Disclosure: I, Melissa Pistilli, hold no direct investment interest in any company mentioned in this article.